| Publication Type | Unpublished |
| Authors | Sherry Miller Hocking |
| Source | (1978) |
| Keywords | tool-text |
| Abstract | unpublished manuscript used as a studio manual at the Experimental Television Center |
"Among the most curious eyes in the whole world of nature is that of a creature the size of a pinメs head - a little known copepod - copilia. She (the males are dull by comparison) has a pair of image-forming eyes, which function neither like vertebrate nor like compound eyes, but something like a television camera...Exner in 1891, reported that the receptor (and attached lens cylinder) make a ムlively, continuous motion.メ They oscillate across the mid line of the animal, and evidently scan across the focal plane of the front corneal Iens. It seems that
the pattern of dark and light of the image is not given simultaneously by many receptors, as in other eyes, but in a time/series down the optic nerve, as in the single channel of a television camera... The receptors move precisely toward, then away from each other - never independently. The speed of the scan varies from about five per second to about one scan every two seconds."
RL Gregory Eye and Brain
"If the motion we attribute to the film image is as illusion, nevertheless the serial still frames of cinema are discretely apprehensible entities that may be held in the hand and examined at our leisure. When these frames are projected, they are uniformly interleaved with equal intervals of total darkness, which affords us intermittent moments to think about what we have just seen. Conversely, the video field is continuous, incessantly growing and decaying before our eyes. Strictly speaking, there is no instant of time during which the video image may properly ムbe said to ムexistメ. Rather, a little like Bishop Berkeleyメs imaginary tree - falling forever in a real
forest - each video frame represents a brief summation within the eye of the beholder."
Hollis Frampton "The Withering Away of the State of the Art" in Douglas Davis The New Television, 1977
The term scanning describes the process by which the raster is constructed in the cathode ray tube of both camera and monitor. The raster is the visible rectangle of light coming from the cathode ray tube or picture tube of a monitor or camera when no picture information in displayed. In the black and white camera the function of the seaming process is to ムreadメ the object before it as a mosaic of varying light and dark values. These changes are then translated into an electrical signal which can be reproduced immediately on a monitor, further processed by an electronic image processing system or recorded by a videotape recorder for storage and later display. The function of the scanning process in a monitor in to display the image of the object presented to the camera. The camera thus translates the object into a signal which reproduces these fluctuations in light and dark; light energy is thus changed to electrical energy. The function of the monitor is to translate the electrical signal containing the image information into a perceivable image; in the monitor, electricity is converted to light energy.
The raster is a rectangular shape constructed by the scanning process in both receiving crt, the camera, and the display crt, the receiver. The proportion of the rectangleメs length to height is 3:4, a relationship referred to as the aspect ratio of the picture; interestingly, this formal relationship of the Pythagorean 3,4,5 right triangle in an organizing principle evident in the histories of geometry and Western art. The ratio, often expressed as 1:1.33 or 1.33, was also the standard adopted by the Academy of Motion Picture Arts and Sciences for film and is the direct derivation of the video aspect ratio; since the early 1950s a number of other film aspect ratios have been used.
In both the camera and monitor, the raster is constructed by a beam of electrons which is focused to a fine point; this point is then moved around in an orderly, repeatable and continuous manner so that the rectangular field of the raster is described. The raster consists of 525 horizontal lines, oriented one on top of the other; the beam draws each line dot by dot. The 525 lines taken together compose one image or frame; it takes the beam 1/30 second to describe one frame, and there are 30 frames or images displayed in one second.
The scanning process is linear and sequential; the electron beam excites a single unit of each line, called a picture element or pixel, which emits light. The beam then progresses to the next pixel. In this way the horizontal lines and ultimately the raster are, at a fundamental level, composed of a matrix of dots. A picture element is defined as the unit of the scan line the length of which, or its time duration, equals the width of the line. This dot matrix is the system by which images are organized is the electronic image processing system; it provides a discontinuous surface, composed of discrete, specifiable units which graphically convey force, texture, space and color. This system has correlaries in the art of engraving and in. the development of pointillist technique; as a system of image transmission and display it is present is the newspaper reproduction of photographs.
Each frame is composed of two separate fields; each field is made up of 262 1/2 lines or exactly half the number of lines comprising one frame. The first field is composed of all the odd numbered lines beginning with line 1 and progressing to lines 3,5,7 and so on to line 525. The second field is composed of all even numbered lines beginning at line 2 and progressing to line 4,6,8 and so one to line 524. Thus the second field fills all of the spaces between the lines scanned during the first field. This method of scanning is referred to as interlace. 2:1 interlace scanning in the camera means that there are exactly 262 1/2 lines in each field and that both fields mesh together precisely to form one frame of 525 lines. The lines of the even field fall exactly half way between those of the odd field. In random or industrial interlace scanning there is no fixed relationship between the lines and fields. The lines of the even field may not fall exactly half way between those of the odd field, resulting in an unstable image.
In the first odd field, the electron beam begins at the top left corner of the crt and proceeds toward the right in a horizontal and slightly downward direction until the beam reaches the right-hand side. This process is referred to as a trace. When the beam reaches the right-hand side the beam is shut-off or blanked out during the time it takes for the beam to return to the left side to begin tracing line 3. This motion and the period of time during which the beam is returning from the right to the left are described as the retrace. During this process of return, the crt is blanked out and the beam is shut off; the linear direction of return from right to left is not visible. No picture information is present during this return, although other information critical to the functioning of the system is contained.
The beam then returns to trace line 5, moving from left to right and describing another line of the image. After reaching the right side the beam returns to the left during retrace and proceeds to line 7. This procedure continues to the bottom of the crt. The last line to be scanned in this odd-line field is not a whole line but a half line, the beam ending the trace in the center of the line. One complete field of 262 ½ lines, or one half of the 525 lines composing one frame or ムcomplete imageメ, is thus described. Figure 1 shows the odd field scanning process.

The electron bean is now at the bottom of the tube sad must return to the top to begin scanning all of the even lines to construct the second or even field. The return of the beam to the top occurs during the vertical interval. The vertical retrace, or the return of the beam to the top of the crt, is not visible because the screen is blanked out during that time; this process is similar in function to the horizontal blanking interval. The vertical interval also contains no picture information but does contain sync information.
The beam is returned to the top of the crt and is located in the center of the first even line, line 2. The beam now constructs all even lines composing the second field in the same manner in which all the odd lines were constructed. The beam traces line 2, moving to the right and slightly down. At the right, the beam begins the horizontal retrace which is blanked out, skips line 3 because it was already scanned in the first field, and begins the trace of line 4. This process for the second field continues to trace all even lines from 2 to 524; line 524 is completely traced. The beam then retraces to the left side of the crt and must return to the top. This return also occurs during the vertical interval and because the beam is blanked out, the return is not seen. This completes the scanning of the second field of 262 even horizontal lines. Figure 2 shows the scanning of a complete frame.

Each frame of 525 lines is composed of one odd field and one even field. Each field is composed of 262½ lines. Each line is composed of approximately 460 individual dots. Figure 3 shows the relationships between the structural elements. The frame is often referred to as the smallest complete single image, even though, unlike film, this unit is not displayed as a whole, all at one time.

Since each field is constructed of 262 1/2 lines, each field displays only half of the information of one ムcomplete imageメ. The image is composed of two separate displays, each display containing half of the total picture information. This method of display wherein the two fields are alternating rapidly means that although the complete image is displayed once each 1/30 second, the fields are displayed at 1/60 second. This helps to reduce the possibility of the perception of flicker. The eye/brain perceptual systems is generally not aware of the rapidity of change between fields, even though each field is only half of the total picture. We are unaware of the changes and perceive one complete image. Persistence of vision is frequently sited as the phenomenon responsible for this perception. Persistence of vision also functions in the perception of the frame which is actually composed of the dots which make up the lines. We do not see dots or lines because of the rapidity with which the lines are drawn by the electron beam in the crt and also because of the composition of the material which is struck by the beam. In the monitor the material tends to glow for a period of time after the beam has moved on; this also helps to enable us to see an image rather than they dots or lines which compose it. The linear character of the raster is evident en close examination of the monitor screen; the dot character is evident in photographic enlargements of pictures taken off monitors.
A single image or frame is two fields, 525 lines or approximately 241,500 dots. This image as recorded exists on tape as two fields, each field consisting of the requisite number of lines. When the tare is played the image is not reproduced as a totality; the image elements are not displayed simultaneously but sequentially. The beam in the monitor excites dots in a linear fashion to form discrete lines; the lines form a field, and the two fields form a frame. Because of the phenomena of persistence of vision and the retentive characteristics of the phosphor surface of the crt, complete images are perceived. The serial nature of image formation is characteristic of video and very unlike film. In video the entire picture exists only as a function of time and is never present as a single entity. The term frame is somewhat misleading because of the implication of a complete image which exists at any one instant of time. The video frame is a process of construction and deconstruction of the image.
One field is scanned every 1/60 second; since the frame is constructed of two separate fields, each scanned 60 tines per second, one frame is displayed in 1/30 second or 30 frames per second. The frame frequency, or the number of times the frame is displayed each second, is 30 cycles per second or 30 Hz. The field frequency, or number of times the field is displayed each second, is 60 Hz. The field frequency is also known as the vertical frequency. The electron beam in scanning moves from top to bottom of the crt in a vertical direction.
The raster then is actually constructed of horizontal lines; in each frame 525 lines are constructed. Since 30 frames are displayed each second, each consisting of 525 lines, there are 15,750 lines displayed each second. The length of time it takes for one line to be drawn is 1/15,750 second or .0000634 seconds or 63 microseconds. The line frequency is thus 15,750 Hs. Line frequency is also known as horizontal frequency because the scanning beam moves from left to right in a horizontal direction.
As has bees described, the frame consists of 525 horizontal lines; thus ideal scanning system of 525 lines is composed of two fields of 262 ½ lines each. Each field is scanned once each 1/60 second; one frame, composed of two fields, occupies a time interval of 1/30 second. In reality, the visible frame contains approximately 483 active scan lines; the remaining 42 lines do not contain picture information but do contain timing information which is necessary to keep the systems in proper synchronization. It follows then that each field is comprised of 241 1/2 active picture lines and 21 lines of timing or sync information.
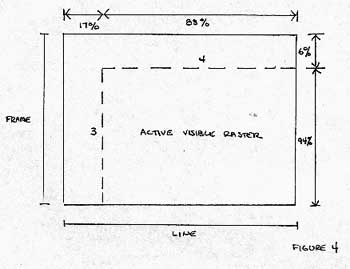
Each complete horizontal line occupies 63.5 microseconds. The horizontal retrace takes up 17% of that line period or 10.8 microseconds; the visible horizontal lines thus occupies the remaining 83% or 52.7 microseconds. This same concept holds true for the frame display. Approximately 6% of each frame period is occupied by the vertical retrace; the remaining 94% of that period contains picture information. The aspect ratio of the raster refers to the proportion of length to height in the active visible raster. Figure 4 indicates the proportions of the active and inactive portions of the frame and line.
The term resolution refers to the capability of a system to present detailed information and is an indication of the smallest unit of change allowable by that system as well as the degree to which different values can be represented as different. The resolution of a particular device in an Electronic Image Processing System may be called coarse which indicates that fine detail is lost and that a series of related but distinct gray levels in an image, for example, may be dealt with as one single value. It is important to note that the benefits of a high resolution device within a system may be lost if the videotape recorder is incapable of recording that amount of information.
Vertical resolution refers to the ability of the video system to resolve horizontal lines. Vertical resolution to a great extent depends on the number of scan lines present in one frame. As we have seen, although the United States scanning system employs 525 horizontal lines, only 490 of those lines are active carriers of picture information; the remaining lines provide timing information critical to the operation of the system as a whole. Another factor influencing the computation of vertical resolution is the size of the beam spot which does the scanning; because the beam spot is finite and occupies space, only a certain number of horizontal lines can be contained within the raster. The Kell Factor is used in the computation of horizontal resolution to take into account the beamメs size. The average vertical resolution is approximately 343 horizontal lines.
Horizontal resolution refers to the ability of the video system to resolve vertical lines; it is usually defined as the number of black and white vertical lines of equal width that can be displayed is an image. The horizontal resolution is determined primarily by the bandwidth of the system; computation must also take into account the time period occupied by horizontal blanking in each line and also the 4:3 aspect ratio of the raster.
Resolution then manifests itself in images that are called sharp or blurry Linearity manifests itself in images sections of which may be distorted; for example, non-linearity in a monitor may reproduce a circular shape an eliptical. Linearity refers to the regular and constant rate of scan of the electron beam in both the horizontal and vertical dimension. If the electron beam as it traces horizontal lines varies in speed, slowing down and speeding up, it is clear that the beam is not representing the image elements accurately with respect to time.
The scanning system which has been described, using 525 lines and 60 Hz, was adopted by the Federal Communications Commission in 1941 and is known as the National Television System Committee, or NTSC standard; this standard is also in use in Canada and Japan. Other scanning systems have been developed which are, in part, based on the standards for electrical current. In the United States the electrical current is defined as 110-120 volts, 60 Hz. As has been seen, the vertical and horizontal frequencies of the scanning process are founded on this 60 cycle per second frequency. The Western European system uses a 625 line scanning system with a 50 Hz frequency standard while the French system consists of 819 lines and 50 Hz.
The development of color video production equipment, particularly of the small format type, had implications for these various standards. The NTSC color standard vas adopted ムムby the United States ix the early 1950s; in addition to maintaining the 525 line, 60 field standard, it defined the way is which color could be transmitted to insure compatibility with the black and white system. The Phase Alternation Line or PAL standard, although partially developed in this country, was accepted in the late 1960s as the color standard for most of the Western European countries. PAL employs the 625 line, 50 Hz standard and defines color transmission standards in a slightly different way than does the NTSC standard. A third standard, SECAM, the Sequential Couleur a Memoirs, was developed 3.s France; this standard employs 625 lines, 50 Hz for color and was also adopted for use by the USSR and Eastern European countries. The SECAM color standard differs substantially from the NTSC and PAL systems.
In 1969 the US adopted the Electronic Industries Association of Japan, EIAJ standard for small-format black and white video; this allowed compatibility of recording and playback on equipment of different manufacture because it defined such parameters as tape and head speed, sync signals, resolution and the placement of various signals on the tape. This standard was later modified to incorporate color information signal recording on a helical equipment; other recording standards, such as ムVHS and Beta, are also in use, primarily with equipment marketed for home as opposed to industrial use. In general it is possible to transfer a tape recorded with one standard to another standard.