| Publication Type | Miscellaneous |
| Authors | Sherry Miller Hocking; Brewster, Richard; Wright, Walter |
| Source | Experimental Television Center, Binghamton, NY (1980) |
| Keywords | tools |
For a PDF of the original document Raster Manipulation Unit: Operation and Construction (1980). Includes a step-by-step description of process of modifying a CRT.
Description
A raster manipulation unit or 'wobbulator' is a prepared television which permits a wide variety of treatments to be performed on video images; this is accomplished by the addition of extra yokes to a conventional black and white receiver and by the application of signals derived from audio or function generators on the yokes. The unit is a receiver modified for monitor capability; all of the distortions can thus be performed either on broadcast signals or, when the unit is used as a monitor, on images from a live or prerecorded source. Although the image manipulations cannot be recorded directly, they can be recorded by using an optical interface. The patterns displayed on the unit are rescanned; a camera is pointed directly at the picture tube surface and scans the display. The video signal from this rescan camera is then input to a videotape recorder for immediate recording or to a processing system for further image treatment. The notion of prepared television has been investigated by a number of video artists and engineers; this particular set of modifications was popularized by Nam June Paik.
The distortions performed on the image result from the actions of audio signals on the yokes. Audio signals which are periodic and regular, such as sine or square waves, are normally used when treating a video image; these signals are derived from an audio or function generator. However, any audio signal source may be employed; these devices include audio synthesizers as well as more conventional components such as audio tape recorders, tuners, microphones or phonographs. These types of signals are most evident visually when used in conjunction with the horizontal or vertical collapse functions which reduce the raster to a horizontal or vertical line. These audio signals cause the line to distort in direct correspondence with changes in the audio signal; often the frequencies present in this type of signal are such that the distortions produced by their actions on a complete image are not very noticeable.
The unit is also capable of reversing the raster around the vertical or horizontal axis, producing images which are reversed left to right or top to bottom in orientation. The raster reversal in combination with audio treatments generate an almost endless series of patterns which are highly controllable. The unit can be used as a normal receiver or monitor end has raster reversal and collapse capabilities with image manipulation functions. It can be utilized in a single camera system or a multiple camera system with or without additional components such as keyers to produce greater versatility in the creation of images.
System Configuration
The complete raster manipulation unit contains a modified receiver/monitor with raster reversal and collapse functions, one stereo and one mono amplifier and three audio generators.
The normal small yoke on the receiver is an electromagnet; when an electrical current is passed through the small yoke on the receiver it generates a magnetic field which deflects the electron beam in the CRT in a regular pattern of horizontal lines called the raster. The scanning process has both horizontal and vertical components. The yoke wires have been extended to two three-position switches. When the raster reversal switches are in the normal position a raster with the customary left to right and top to bottom orientation is achieved. By reversing the direction of the electric current through this small yoke on the receiver the raster is reversed in either its top-bottom or left-right orientation or both simultaneously. This occurs when the switches are in the reverse positions. The normal scanning operation is actually reversed in orientation; the electron beam in the horizontal scanning process is deflected from right to left rather than left to right, while in the vertical scanning process the beam is deflected from bottom to top rather than top to bottom. When both switches are in reverse positions, the beam is deflected bottom to top and right to left simultaneously.
By removing the electric current from either the horizontal or vertical deflection systems of the stall yoke, one horizontal or vertical line is produced. If the current is removed from the horizontal scanning operation, one vertical line is produced. This indicates that the electron beam is not moving to the left or right but is only being drawn downward on the CRT, producing a vertical line.
If current is removed from the vertical operation, one horizontal line is obtained because the electron beam is scanning to the left and right but it is not being drawn downward. When no current is passed to either the horizontal or vertical systems the electron beam is not moving either horizontally or vertically, and one point is produced. It is important to note that when the raster is collapsed to a point or line, the contrast and brightness controls on the receiver/ monitor should be turned down to prevent permanent burning of the CRT.
Two other yokes have been added to the unit, one color yoke and one continuous wind yoke. If a continuous current is passed through the horizontal portion of this large color yoke, the effect of both large and small yokes is combined; the raster is shifted horizontally either to the left or right depending upon the direction of the current. If the continuous current is passed through the vertical component of the color yoke, the effect of both large and small yokes is combined to shift the raster in a vertical direction either up or down. The effect of the continuous wind yoke which was added to the receiver/monitor produces an 'S carve' distortion of the raster.
The purpose of the audio amplifier in the system is to drive the yokes of the receiver/monitor. Because the yokes are electromagnets, they react to the audio amplifier in much the same manner that a sound speaker responds; the yokes are driven with the audio amplifier. A mono amplifier is a single channel device which accepts an audio signal as an input and amplifies or increases the signal; a stereo amplifier amplifies two separate sound inputs.
The audio generators provide audio signals to the mono and stereo amps in much the same way that a tuner or turntable provides a source of periodic or continuously repeated, regular waveforms. They are normally used when distorting a full raster. Frequencies which are multiples of the vertical sync rate of 60 Hz produce the most obvious and symmetrical distortions; examples of such frequencies include 60 Hz which is the vertical sync rate multiplied by 1, 30 Hz which is one half the vertical rate or 60 Hz x .5 and 90 Hz or 60 Hz x 1.5. This range of frequencies is usually found on audio generators. It is possible to use an audio tape recorder, tuner or phonograph as a source for audio signals rather than an audio generator; in this instance the signals which will distort the raster are not necessarily periodic and may contain a wide range of frequencies, same of which may have little or no visible effects on the raster. These non-periodic waveform sources produce more evident distortions if the raster is collapsed first to a horizontal or vertical line. In this case the line will visibly respond to most of the frequencies found in signals derived from audio tape decks, microphones, tuners or phonographs. The lines also respond to audio signals originating in the audio generators. The notions of these lines caused by these types of audio signals have been referred to as 'dancing patterns' by fan June Paik.
All electrical signals have a waveform, indicating changes in voltage measured through time. Some signals have a periodic or repeating, regular waveform while others produce random or non-periodic waveforms An oscillator is a device which produces a regular and periodic waveform; for example, an oscillator may produce a sine, square or triangle wave. A waveform generator usually puts out one defined waveform; an example is a square wave generator. These devices are frequently used for test purposes in the electronics field. An audio or function generator may permit selection of one of several waveforms, for example sine, square and triangle. These devices may also offer control over the frequency or amplitude or they may be capable of locking to an external signal. These devices are available commercially or in kit form. Oscillators may also be constructed from discrete components. Any of these devices may be utilized with the raster manipulation unit, but it is desirable to have at least two different waveforms available.
An oscilloscope is a device which visually displays the waveforms as a change in voltage through time; the shape is diagrammed with the X or horizontal axis representing time and the Y or vertical axis representing changes in voltage. The term periodic refers to a waveform wherein a regular, repeating pattern is observable as the voltage changes through time; sine, square and triangle are all files of periodic waveforms. Figure 1 indicates the shapes of different waveforms.
A waveform may begin at any point but when it returns to the point of origination the waveform has completed one cycle. Cycle refers to the completion of one rise, fall and return of the signal. It is important to note that the waveform may pass through the particular voltage at which it began a number of times before one cycle is completed. For example, in Figure 2 the sine wave begins at voltage = 0 and passes through this point value exactly half way through one cycle before ending at this point one second after beginning. The time in which it takes for one waveform to be completed is referred to as the period of the waveform. The number of times this waveform is repeated in one second is called the frequency of the waveform; frequency refers to the speed of the signal. The umber of cycles the signal completes in one second is measured in cycles per seconds expressed as Hertz or Hz. Figure 3 illustrates this. The range of human hearing is between 15 Hz and 20,000 Hz or 20 KHz; frequencies below 15 Hz are subsonic while those above 20 KHz are ultrasonic. Audio generators commonly put out a range of 310-30,000 Hz approximately those frequencies within the range of human hearing. The amplitude of the signal refers to the peak voltage which the signal attains. It refers to the strength of the signal and is measured by the height of the waveform expressed in volts.
The waveform may consist of a positive and negative voltage dimension; the total voltage of the signal, obtained by the addition of positive and negative extremes is referred to as peak-to-peak voltage and abbreviated Ppv. Figure 2 indicates these components of a waveform. The tern phase refers to the relative timing of one signal in relation to another; if one signal is 'in phase' with another they both possess identical timing and have began at the same instant. Figure 4 shows this relationship. A waveform say also be amplitude and frequency modulated. In amplitude modulation, the amplitude of the signal which comes out of the function or audio generator is determined by the amplitude of a second signal which is fed into the function generator; in this case the frequency of the output remains the same as the normal output. In frequency modulation, the amplitude of the output signal remains the same as the normal output signal but the frequency of the output signal is determined by the frequency of a second signal which is fed into the function generator. Figure 5 diagrams these processes.

A sine wave is a plot of the trigonometric function and is the most basic of waveforms; all other complex waveforms can be constructed from sine wares. A sine wave consists of a fundamental and harmonics shown in Figure 6. In a square wave the voltage is either on or off, both for equal periods of time. A square gave can be constructed by the addition of all odd harmonics to the fundamental; as each odd harmonic is added, the shape of the wave approximates more closely a square wave. All harmonics of the square wave are in phase. A sawtooth wave is built up from both even and odd harmonics; all harmonies of a sawtooth are also in phase. All truly symmetrical waveforms are built only from odd harmonics; a sawtooth wave is not truly symmetrical because it rises linearly with time and then drops to its lowest voltage, but the time increments for rise and fall are unequal. A triangle wave rises and falls linearly with time, and the rate of change for both the increase and decrease periods is equal. Fourier's theorem establishes this primary relationship of all periodic waveforms to a sine wave and states that air periodic waveform is composed of the addition of sine wave harmonics.

Figure 7 indicates the basic configuration of the raster manipulation unit. 
Image Vocabulary
The following is a list of suggested procedures for initial use of the raster manipulation unit. It is helpful to charge one control variable while maintaining all other variables constant; this procedure will assist in an orderly investigation of the parameters of the system. It should be noted that this description uses only the sine wave function of three oscillators; if square or triangle waves are available, proceed with each separately axed then combine waveforms.
Initial control settings are as follows:
Oscillators:
waveforn select: sine
frequency: 60 Hz frequency
multiplication: 7C1
output selector: .5V
output level control: midrange
Amplifiers:
input selector: auxillary
bass: high range
treble: midrange
volume: midrange
The use of one sine wave oscillator connected to the horizontal portion of the large yoke with a frequency of 60 Hz produces an even sine-shaped bending of the raster. Figure 9.
By collapsing the horizontal portion of the raster, a sine wave along the vertical axis is produced. Figure 10.
Two vertically oriented sine waves 180° out of phase are produced if the oscillator frequency is set to 30 Hz
Restoration of the horizontal portion of the raster produces two images moving in opposite directions. Figure 11.
The use of one oscillator connected to the vertical portion of the large yoke with a frequency of 60 Hz produces a raster compressed on top and bottom and elongated in the center section. Figure 12.
Increasing the volume on the amplifier will cause the image to fold. Collapsing the vertical portion of the raster will cause the image to roll vertically. Figure 13
The use of two oscillators, one connected to the horizontal and one to the vertical portion of the yoke, and both with frequencies of 60 Hs, along with collapse of the horizontal portion of the raster produces a cursive "e" shape on its side. Figure 14.

Collapsing the raster to a point and setting both oscillators to 60 Hz will produce a circle which rotates about a 450 angle. Variations in the frequencies will produce a family of patterns called Lissajous patterns which are formed by the application of sine waves to the horizontal and vertical deflection systems of a CRT. These patterns can also be produced on an oscilloscope. The patterns vary depending upon the frequencies of the sine waves, their phase and amplitude relationships. A circle is obtained by applying two sine waves of equal amplitude but 90 degrees out of phase with each other to the horizontal and vertical deflection systems. If the amplitudes of the signals are unequal but the sine waves are 90 degrees out of phase then an ellipse is formed; if the horizontal voltage is greater than the vertical, the ellipse is oriented such that the dimension along the Z axis is greater than the Y. If the vertical voltage is greater than the horizontal, then the orientation of the ellipse is reversed, and the dimension along the Y axis is greater than the X. Inclined ellipses result from two sine waves which are other than 90 degrees, 180 degrees or 360 degrees out of phase. The inclination of the ellipse varies as the phase relationship varies. If the sine waves are in phase or 180 degrees out of phase or 360 degrees out of phase, then a diagonal line is formed. Figure 8 provides a table showing the changes in orientation with variations in phase relationship.
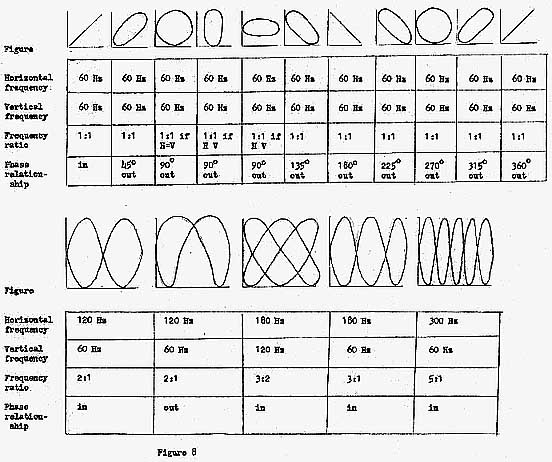
Other patterns are obtained, depending on the frequency ratio of the sine waves applied to the horizontal and vertical deflection systems. For a specific frequency ratio there is a basic pattern formed if the two sine waves are in phase; if the sine waves are not in phase then variations on these patterns are produced. For example, if a 120 Hz sine wave is applied to the horizontal and a 60 Hz sine wave applied to the vertical and both are in phase, then a basic pattern, called the bow tie or figure 8, is produced. This is illustrated in the bottom section of Figure 8. The frequency ratio can be determined by the number of tangent points along the horizontal and vertical axes of the pattern. The table shows that there are two points of tangency along the horizontal and one along the vertical, producing a frequency ratio of 2:1 for the bow tie or figure 8 pattern. If the two sine waves are not in phase, the pattern varies but the ratio remains the same. Frequency ratios of 3:2, 3:1 and 5:1 are also illustrated. To obtain these patterns, the frequency adjustments must be precise; variations in frequency will cause the pattern to change rapidly.
A sine wave oscillator connected to the 'S curve' or continuous wind yoke of the raster manipulation unit with a frequency of 60 Hz produces an image with as S curve containing compression and elongation. Figure 15.
The use of all oscillators simultaneously, the addition of square and triangle waveform capability and adjustment of frequency and amplitude will produce an extensive vocabulary of image treatment.
The Raster Maniuplation Unit